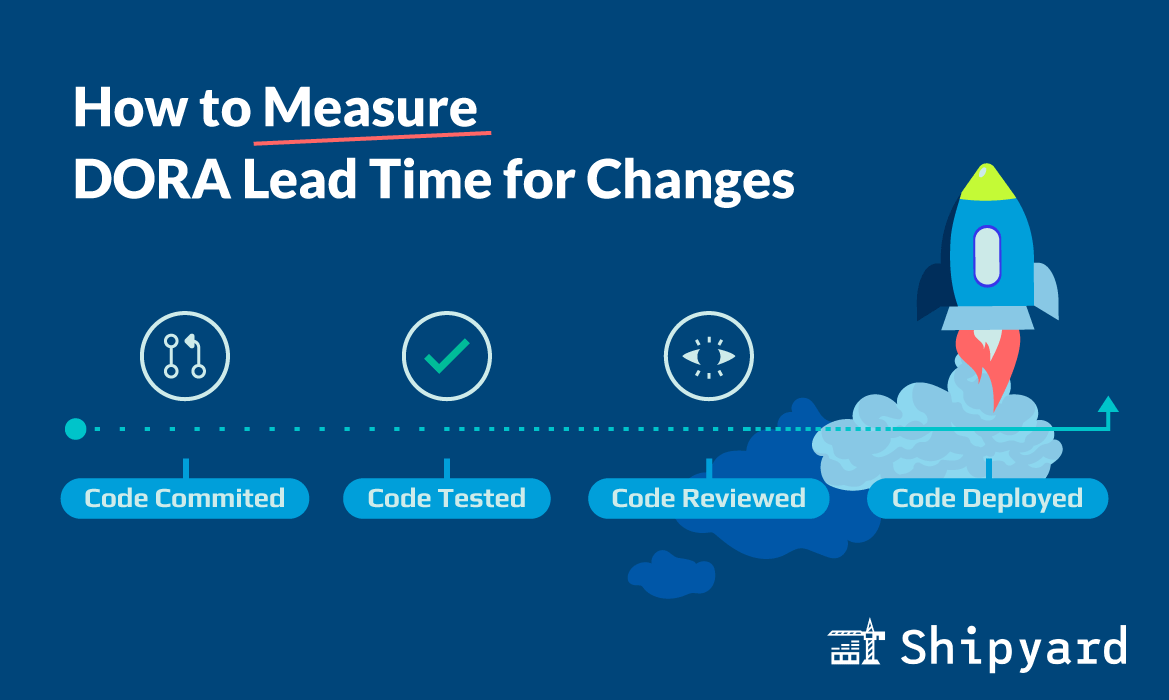
If you’re trying to improve your DORA change lead time, the first step is finding a way to measure it. Here are a few ways we’ve seen teams collect data for this metric.
TLDR: change lead time = timestamp of deploy - timestamp of initial commit
What is lead time for changes?
Lead time for changes is one of the four key DORA metrics. It measures how long it takes for code committed to a branch (either main or a feature branch, org-dependent) to hit production.
After you make a commit, there are a few things that need to happen:
- You’ll need to get that code deployed to a representative test environment
- Your CI/CD pipeline will validate code changes and run automated tests against them
- Your developer peer will perform a code review
- Your product manager and designer might also review your changes
- Your approved changes will now await the next production deployment
For some teams, this can happen within a day. However, depending on your processes, there can be even weeks or months of change lead time between a commit and its deployment. There are a bunch of moving parts here — it can help to zoom in and measure them individually to get more clarity on where the bottlenecks are.
Lead time vs lead time for changes
There’s an important distinction between lead time for changes and traditional lead time. Lead time measures the time spent from ticket creation to deployment. Lead time for changes is a better, and more consistent measure of your deployment practices. Since some features might remain in backlog or take varying amounts of time to develop, lead times may be all over the board. Lead time for changes will be easier to pinpoint and improve, since the deployment process consists of a few repeatable steps that remain more or less the same for all feature types.
How to measure lead time for changes
Change lead time is incredibly easy to measure. If you want to keep it simple, you can create a spreadsheet to track timestamps of each commit, and timestamps of their corresponding deployments.
To get the lead time, you’ll simply just subtract the two timestamps.
From here, you can visualize the data over time, by creating bar graphs (e.g. one bar for each commit). For teams with relatively short change lead times, this can be measured in units of hours. If lead times trend over a week, measuring in units of days might make more sense.
Measuring stages of change lead time
“Lead time for changes” itself is useful as a benchmarking metric for your org’s overall performance. But when you want to shorten change lead times, the data isn’t transparent enough. You’ll want to see how long each “stage” of your lead time ends up being, so you know exactly where to optimize.

In this example, total change lead time is broken down into five stages. Notice here how the longest segment is response time. This can help us investigate the bottleneck further:
- After the commit, how long does it take for peer(s) to submit code review?
- What timezones are your reviewers in?
- How many peers need to submit a review?
The sample stages shown in the chart can be measured with key source code management (SCM) events. Spend a few months collecting these timestamps: time of commit, time of review, time of revision, merge to main, and deployment (and modify these stages and their definitions to fit your team).
Collecting key event data
If you want to go one step further and automate your change lead time data collection, there are a few options. Both GitHub and GitLab have public APIs with endpoints that provide enough data to measure change lead time.
For GitHub, you can request a repo’s commits. The response will include a timestamp for each commit, under both the author and committer fields. If you’re using GitHub Actions to deploy to production, you can request the timestamp of a workflow run. You can break this down into stages as you see fit (e.g. getting code review data on a PR).
GitLab offers an endpoint for commits, from which you can get commit time. You can also request deployment times. GitLab also offers a DORA API for Ultimate users, from which you can just directly request the change lead time.
What is a good lead time for changes?
The 2023 DORA Report states that Elite performers have change lead time of less than one day. 18% of respondents are at this level.
Elite DORA metrics are a high bar. With DORA, continuous improvement is more important (and more relevant) than going after a specific number. You’ll need to assess what numbers make sense for your org, and what might be realistic given your current DORA metrics.
Many teams can easily bump their change lead time to DORA’s High performance level, which means keeping lead time between one day and one week. About 31% of DORA respondents fall within this range.
The short answer here? If you’re shipping features with under a week of change lead time, you’re doing pretty well. If not, it might be worth making a few tweaks to your processes. The key here is finding what lead time is ideal for your org — what does your product need when it comes to stability, cost, and efficiency?
Trying to improve change lead times?
Once you know how to measure change lead times, it’s easier to improve them. Even if your metrics system isn’t perfect, your team should start collecting lead time data ASAP. This will be one of the quickest (and most passive) ways to find bottlenecks in your deployment process.
At Shipyard, we believe that enabling developers with access to on-demand environments is the shortcut to quick change lead times. When developers can create environments on every pull request, they can share them with stakeholders and reviewers to get faster and more thorough feedback. This cuts out staging environment wait times, and allows devs to run E2E tests as soon as they open a PR.


